CIMB (1023) - Technical Analysis
- HONG WEI GIET
- Nov 22, 2019
- 2 min read
Technical Analysis
===========

Long term view
===========
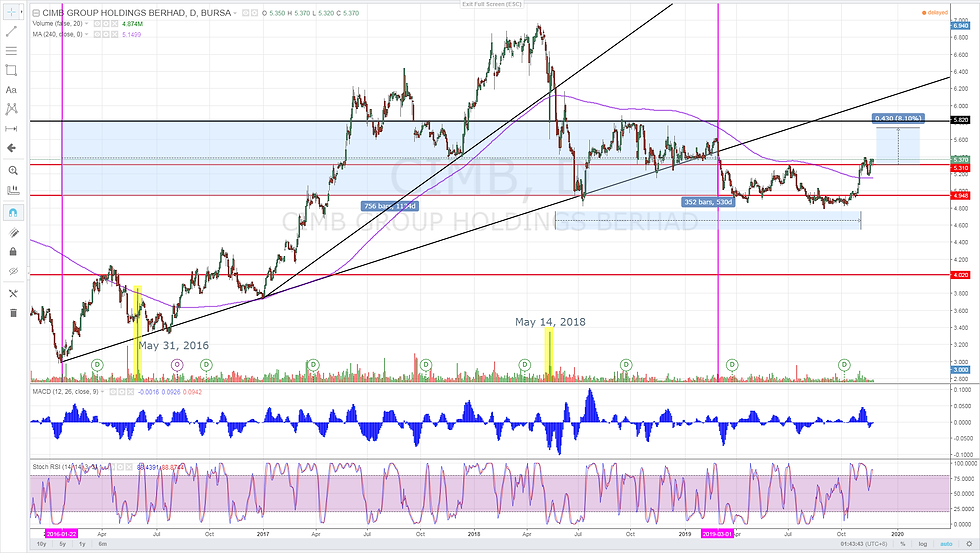
- CIMB shares price started a long term uptrend since Jan 22, 2016, and it tried to challenge MA240 but it failed to trade above MA240.
- However, there was a significant volume entered the market to support CIMB shares prices and it continued the upward trend and record higher high until May 14, 2018, where is the second extraordinary volume in the past 2 years.
- Furthermore, it led CIMB shares price traded below MA240 which is a starting point of downward in long term views.
- It is a good learning point for a technical analysis perspective: (a) if you notice a huge volume at the bottoms level, it might lead a long term upward trend; (b) if you notice an extraordinary huge volume at the high level, it is a red flag indicator to exit the counter.
- CIMB shares price unable to trade higher after the huge selloff on May 14, 2018. so far and end the long term upward trend on Mar 3, 2019. (756 trading days)
- Thus, we able to conclude CIMB shares price have a high correlation with MA240 and MA240 is a good indicator for long term investor's investment decision making.

Short term view
===========
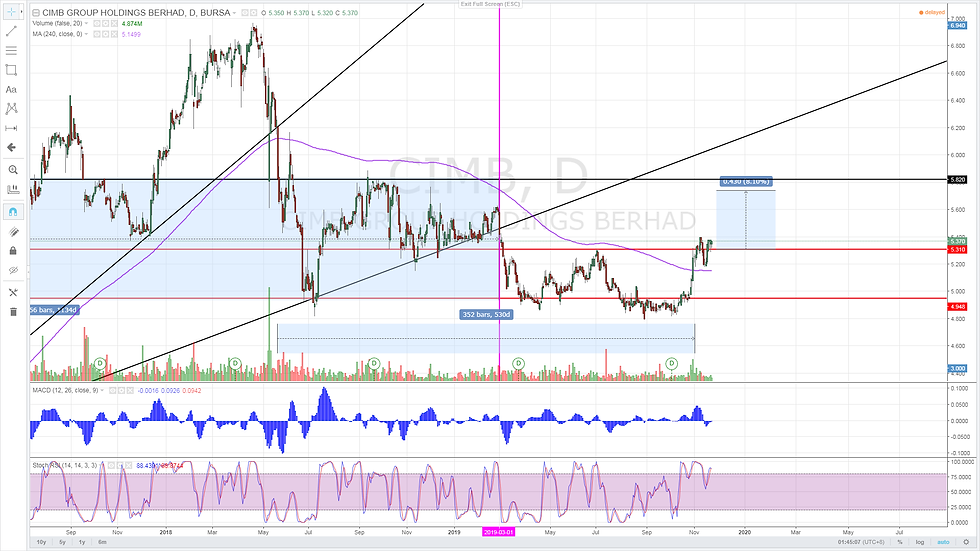
- After 352 trading days, CIMB shares price traded above MA240 finally. Meanwhile, CIMB shares price completed a double bottom (W-shape) concur with a retracement testing.
- RSI also enters a dull status and maintain above 80 levels/overbought status.
- Even though CIMB declared net profit down by 14% in Q3 2019 due to higher operating expenses and provisions, despite an increase in operating income which is majorly contributed by NII, there is no immediate negative impact on CIMB shares prices.
- Thus, we opine that CIMB shares price is entering a middle term upward trend.
- Resistance (2): RM 5.820
- Resistance (1): RM 5.616
- Support (1): RM 5.310
- Support (2): RM 5.144
Comments